Using Grafana Loki as a Centralized Logging Solution
Today, I’ll explain how to use Grafana Loki as a centralized logging solution for all your Docker containers. As your infrastructure grows and more containers are added, troubleshooting via logs becomes increasingly important. You might need to diagnose issues like a database failure or an SSL certificate that didn’t renew. Personally, I used to check logs with the docker logs command, but this approach isn’t efficient. Imagine trying to filter logs for a specific time window — like 12:00-12:05 UTC on May 5 — or investigating issues that span multiple containers, such as when a database failure causes an error on an Nginx container. Instead of manually piecing logs together from different machines, it’s more efficient to store all logs centrally, enabling simultaneous searches across all containers. With Loki, you can set up alerts, filter specific log entries using regex, and much more.
In this post, I’ll walk you through how I set up a centralized logging solution for all my Docker containers using Grafana Loki.
Step 1: Install Loki
I recommend installing Loki with Docker Compose. Here is Grafana’s default docker-compose.yaml file for Loki:
Grafana Loki Docker Compose Documentation
And here is the code itself:
Grafana Loki Docker Compose YAML
Since we don’t need Promtail (Loki’s log collector), we can comment that part out. I’ll also add volume configurations:
version: "3"

networks:
  loki:

services:
  loki:
    image: grafana/loki:2.9.2
    ports:
      - "3100:3100"
    command: -config.file=/etc/loki/local-config.yaml
    volumes:
      - loki_data:/loki
    networks:
      - loki

#  promtail:
#    image: grafana/promtail:2.9.2
#    volumes:
#      - /var/log:/var/log
#    command: -config.file=/etc/promtail/config.yml
#    networks:
#      - loki

  grafana:
    environment:
      - GF_PATHS_PROVISIONING=/etc/grafana/provisioning
      - GF_AUTH_ANONYMOUS_ENABLED=true
      - GF_AUTH_ANONYMOUS_ORG_ROLE=Admin
    entrypoint:
      - sh
      - -euc
      - |
        mkdir -p /etc/grafana/provisioning/datasources
        cat <<EOF > /etc/grafana/provisioning/datasources/ds.yaml
        apiVersion: 1
        datasources:
        - name: Loki
          type: loki
          access: proxy
          orgId: 1
          url: http://loki:3100
          basicAuth: false
          isDefault: true
          version: 1
          editable: false
        EOF
        /run.sh
    image: grafana/grafana:latest
    ports:
      - "3000:3000"
    volumes:
      - grafana_data:/var/lib/grafana
    networks:
      - loki

volumes:
    grafana_data: {}
    loki_data: {}
Step 2: Configure Containers to Send Logs to Loki
Once the Loki container is running, configure your containers to push logs to Loki. First, install the Docker plugin and restart the Docker engine:
docker plugin install grafana/loki-docker-driver:latest --alias loki --grant-all-permissions
systemctl restart docker
Verify that the plugin is installed:
docker plugin lsYou should see your newly installed Docker plugin:
ID             NAME          DESCRIPTION           ENABLED
ddd2367c8693   loki:latest   Loki Logging Driver   true
Next, configure each container to send logs to Loki by adding these lines in your docker-compose file (replace loki-ip with the actual IP of your Loki server):
logging:
  driver: loki
  options:
    loki-url: http://loki-ip:3100/loki/api/v1/push
Alternatively, configure Docker to send logs from all containers by creating an /etc/docker/daemon.json file (again, replace loki-ip with the actual IP of your Loki server):
{
    "debug" : true,
    "log-driver": "loki",
    "log-opts": {
        "loki-url": "http://loki-ip:3100/loki/api/v1/push"
    }
}
After making these changes, recreate your containers to start logging to Loki. With Docker Compose, run the following:
docker-compose down
docker-compose up -d --build
If you chose the daemon.json approach, restart the Docker service:
systemctl restart dockerLoki doesn’t pull logs; instead, Docker pushes logs to Loki. Ensure Docker can reach Loki on port 3100 (if using the default). Test connectivity with telnet from the Docker host:
telnet loki-ip 3100Step 3: Viewing Logs in Grafana
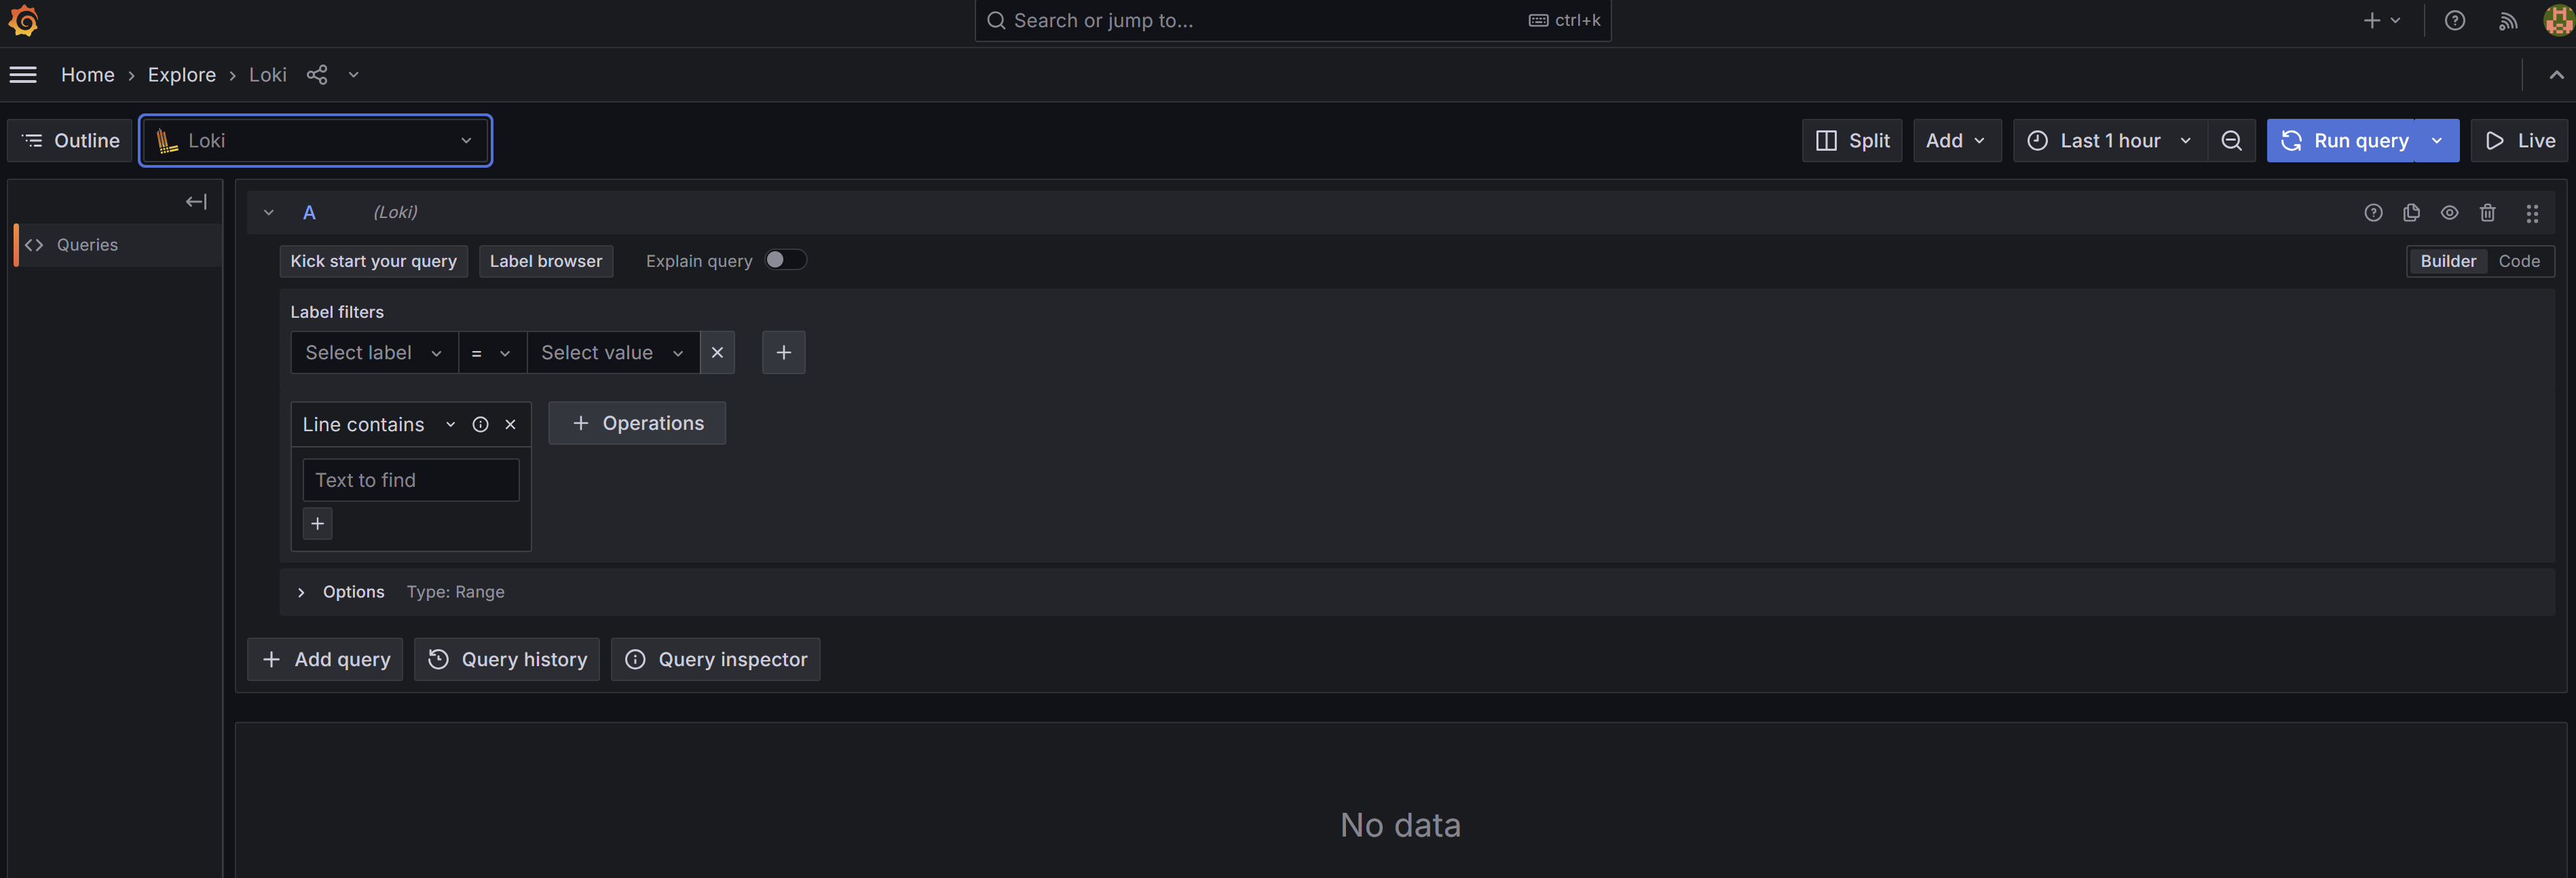
Now you should be able to see logs in Grafana. Go to the “Explore” section, and make sure “Loki” is selected in the top-left dropdown menu:

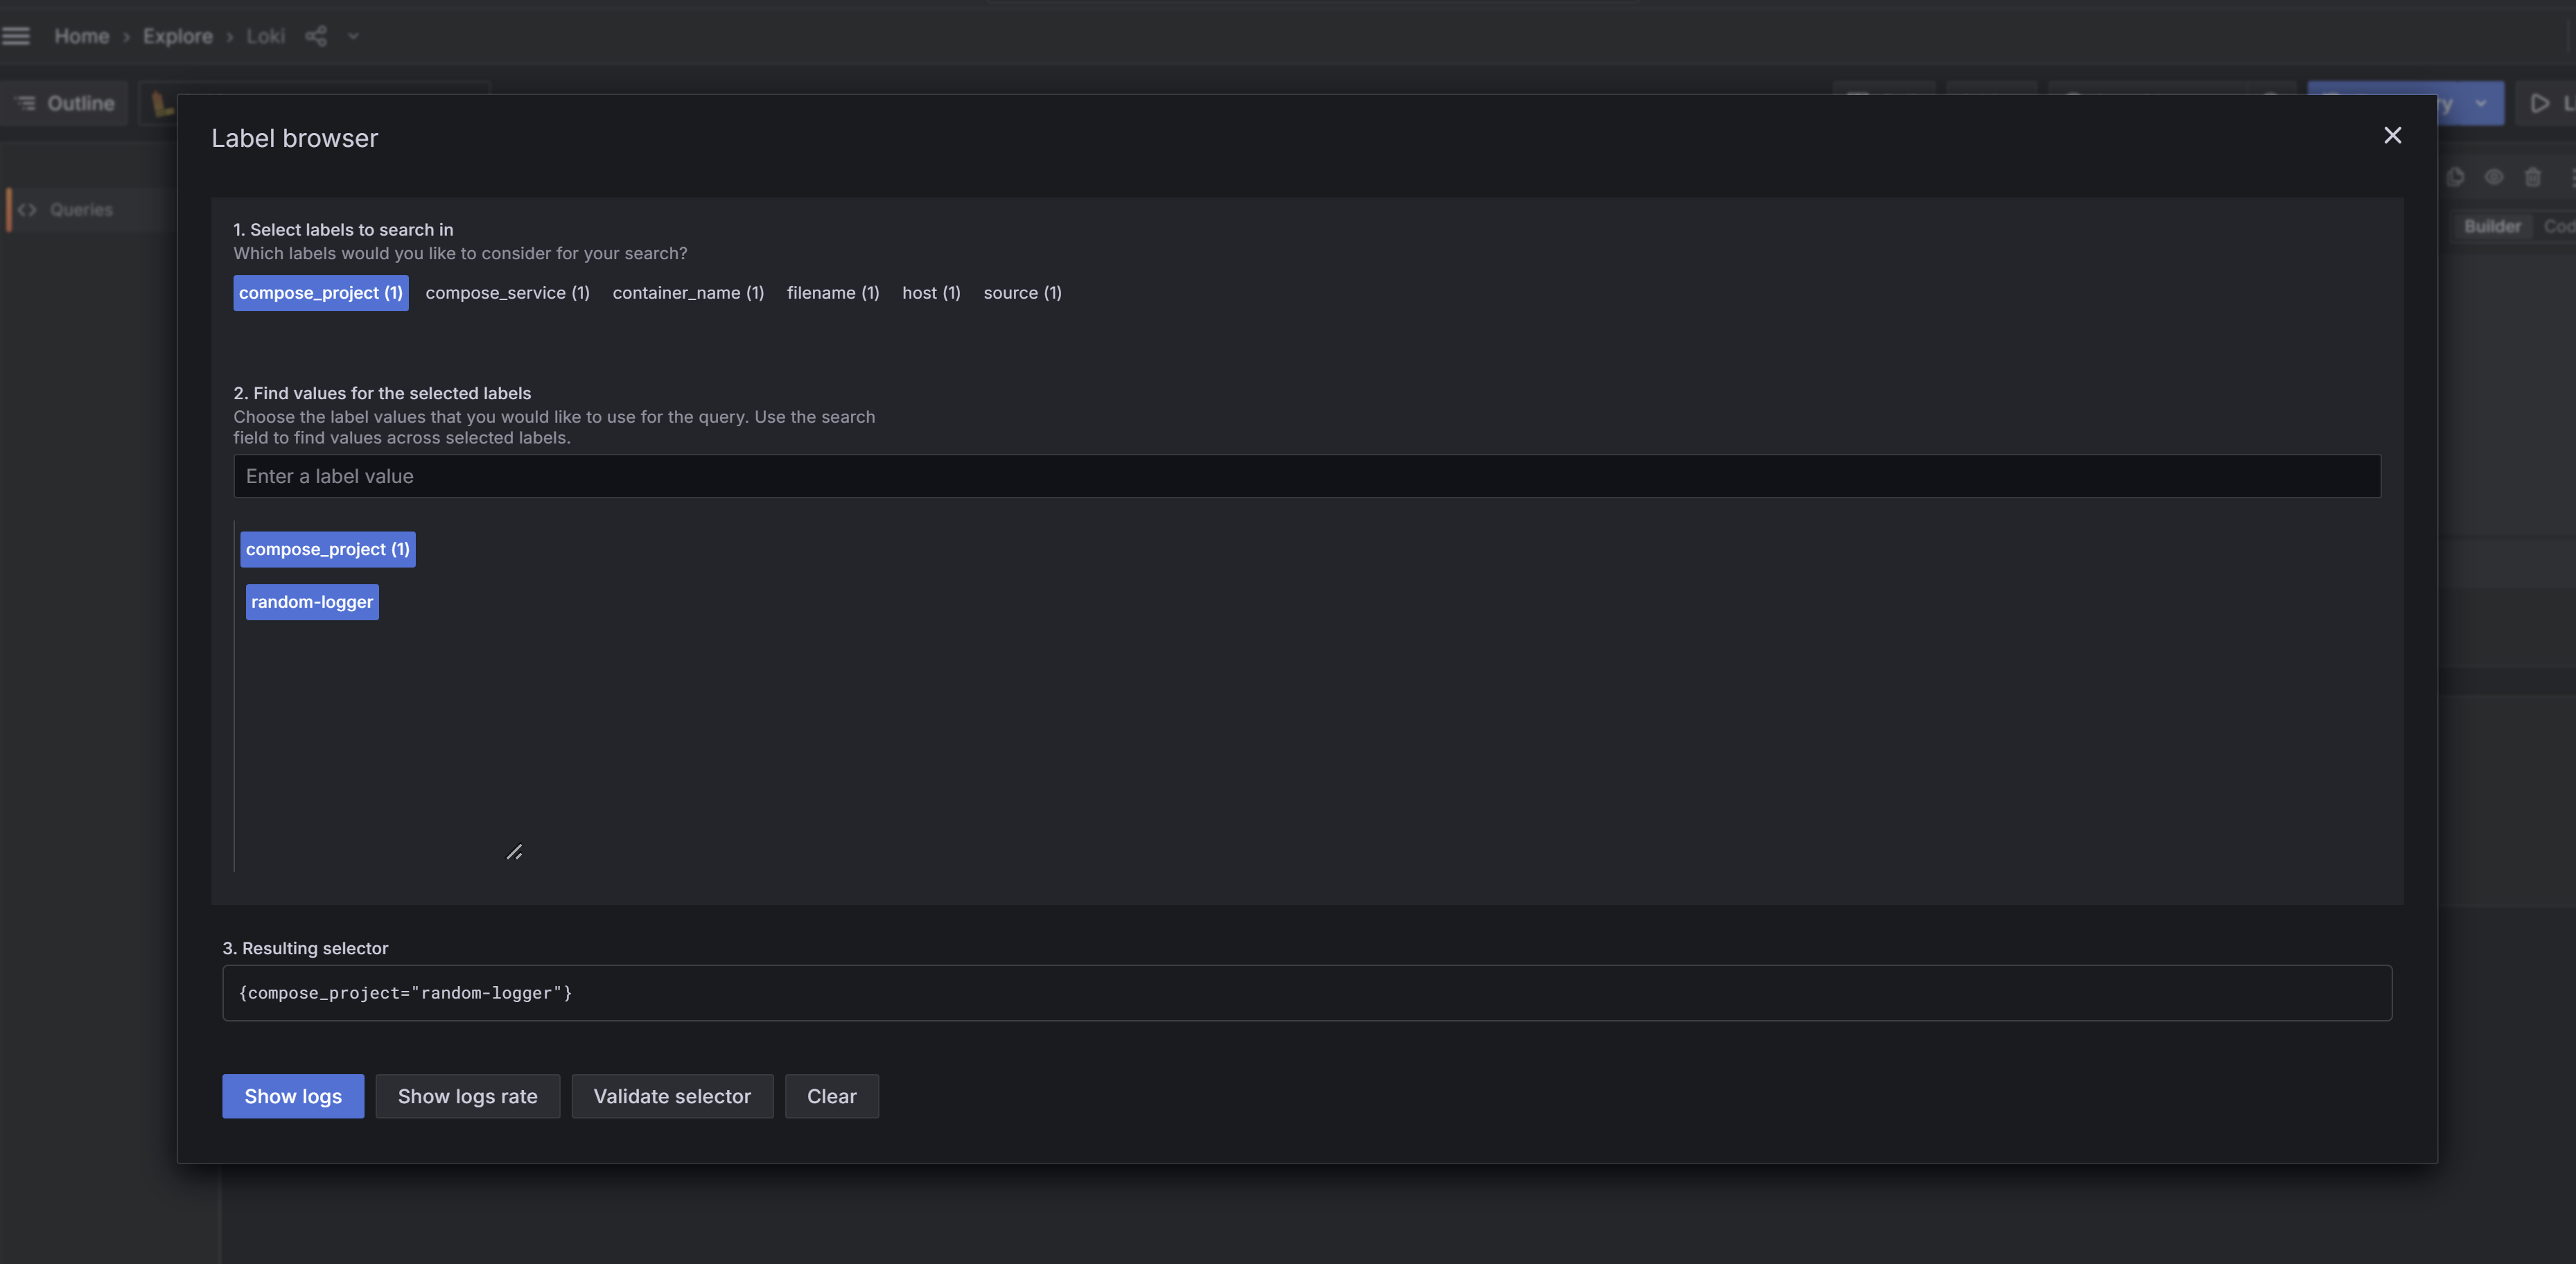
Then, click on “Label Browser” and select the appropriate label. In this example, it’s compose_project => random-logger. Then click “Show logs”:

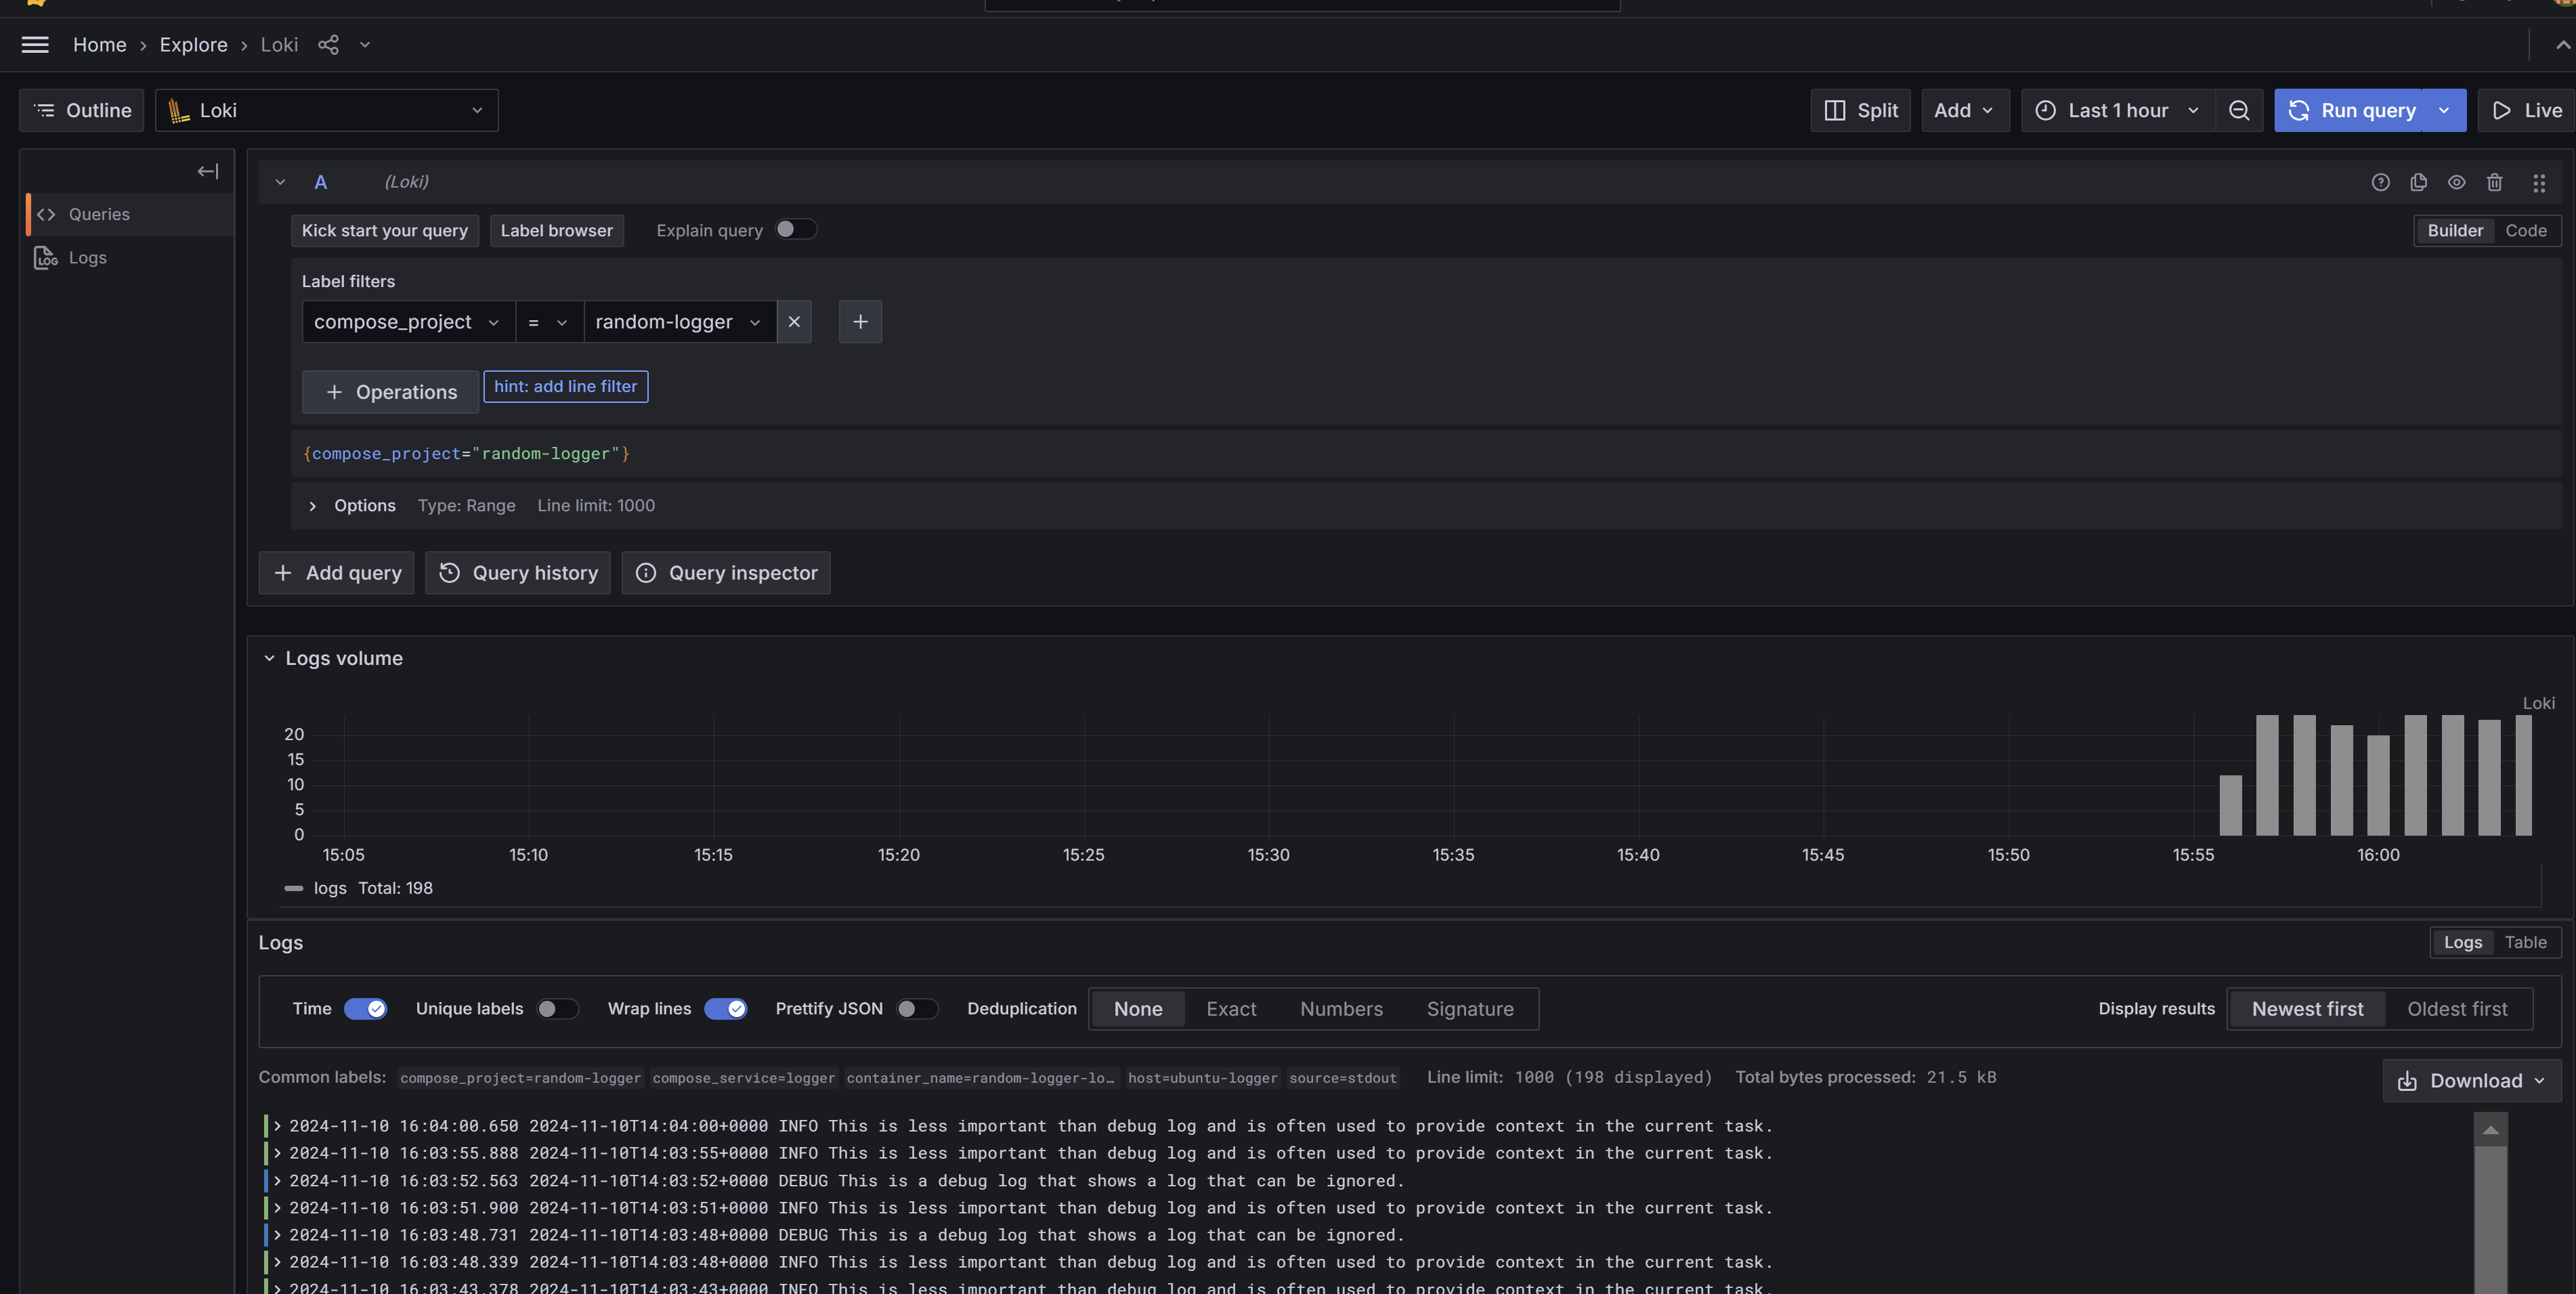
After clicking “Show logs,” you should see your logs:

That’s it! At this point, you’ve successfully set up Grafana with Loki, and your Docker containers should be sending logs to it. For the next steps, you might consider setting up data retention policies in Loki and creating custom dashboards — I’ll leave that as a homework exercise.